Automatic Presentations
The Automatic presentation mode supersedes the old way of presenting your data in Excel. Automatic presentations automatically track changes you make on the data tab. For instance, if you add new columns or change the grouping, the change automatically appears on the presentation tab.
Automatic presentations also do away with row padding. This means you may have as many grouping levels as you want (formerly had a limit of 3 group levels). Also, the new mechanism is more efficient with memory – so the size of your resulting report will be smaller as well.
Automatic presentations work seamlessly with downstream Excel formulas and charts. Automatic presentations keep formulas and charts intact as your incoming query data changes. Also, the formulas track changes to the List calculation. For example, if you add a row to a List, all formulas based on other amounts will remain unaffected.
Finally, Automatic presentations let you quickly create beautifully formatted report elements. To get you started, we’ve provided over 30 different customized styles that you can quickly apply and customize.
Creating an Automatic Presentation
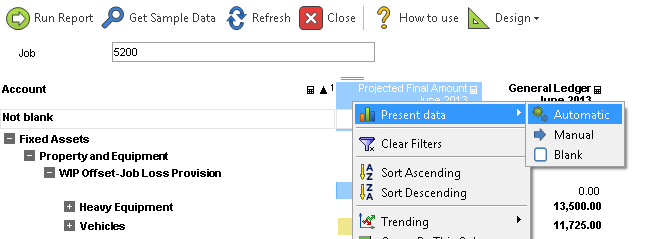
To automatically present your data in Excel, right-click a column to get
the Column Menu. Select
 Present data > Automatic.

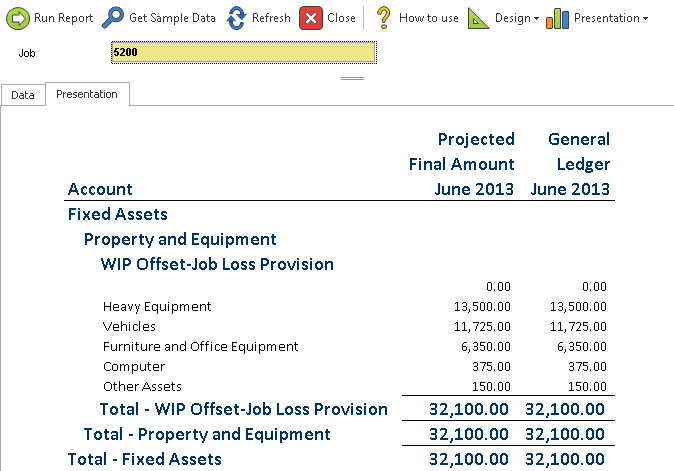
DAS will embed Excel under the Presentation tab and map all visible columns automatically with the default style (more on that later). Note also the appearance of the Presentation menu item in the toolbar (see Control the Excel Presentation).

Once you create your automatic presentation, you can control it in many ways.