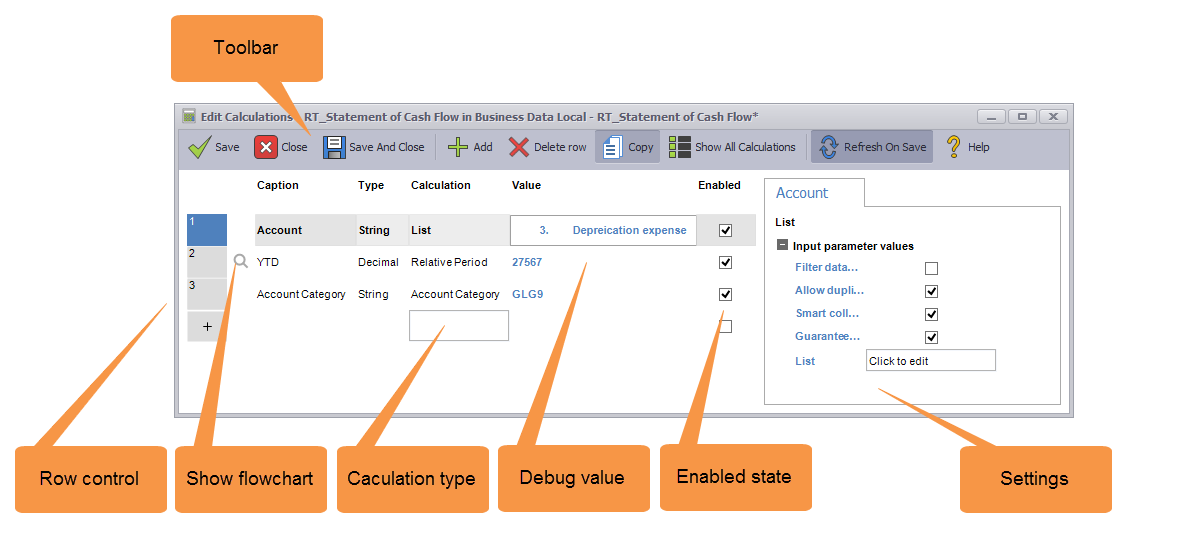
Edit Calculations with the Editor
Data Access Studio provides the following ways to edit calculations.
| To | Do this | |
|---|---|---|
| Edit a single calculation | Double-click the Column Header. Or right-click the Column Header, and select Calculations | Edit... Either of these actions will take you to the calculation flow view (see below) |
| Edit all calculations | Click Design | Calculations.... This option will take you to the calculation list view |
DAS has two ways to view calculations.
1) The calculation list view, where all the calculations are shown.
2) The calculation flow view, where the flows into a selected calculation are shown (see Calculation flow view below)
Calculation list view
The calculation list view allows you to add, delete, edit, and copy calculations. You can rearrange the display order of the calculations by drag and drop.

To |
Do this |
Add a calculation |
Click on an empty box under Calculation type. Click on the Visual Assist to select from a list of available calculations. Or type in the name of the calculation directly. Click TAB to apply. Once applied, the calculation-specific parameters will show under the Parameters tab. |
Delete a calculation |
Highlight one or more calculations on the left-hand side. Click |
Edit a calculation |
Highlight the calculation row on the left. Edit the values under the Parameters tab. You may also change the Column Caption and Output Type (if the particular calculation allows it). |
Copy a calculation |
Highlight the calculation and click |
Disable a calculation |
If you want to keep a calculation from running, but you don't want to delete it, you can uncheck the Enabled checkbox for the calculation. When a calculation is disabled, it will emit the default value for the calculation and skip running the calculation itself. |
Re-arrange the calculation display order |
When viewing the list of calculations, it can be handy to re-arrange the row display order of the calculations. To re-arrange calculations, click on the Row Control area. Drag and drop the calculation row to the desired location and drop. You may rearrange multiple calculation rows at a time (user standard Ctrl-click and Shift-click) to select multiple rows |
See the value of a calculation for a row |
If your grid has rows loaded, the Value column will show the calculated values for that row. To select another row to evaluate: Right-Click the Value column. Select Evaluate Previous Row to see all calculation values for the previous row Select Evaluate Row (nnnn) to re-evaluate the values for the current row Select Evaluate Next Row to see all calculation values for the next row Check/Uncheck Auto-evaluate to turn calculation evaluation on or off respectively (default is on) You may also evaluate the calculations directly from the report. If you are on the Data tab of your DAS report, you can right-click a detail row and select the Debug option. Once selected, DAS will show the calculation editor and evaluate the calculations for the row you selected. |
See calculation dependencies |
If your calculation row shows a magnifying glass in the row (Show flowchart), then this means the calculation depends on the results of other calculations. You may click the magnifying glass to see the flow chart. |
Typing shortcuts:
| Key | Effect |
|---|---|
| TAB/SHIFT+TAB | Tab to the next/previous editable field. Tab from the last editable field of the header row will activate the first editable field in the Parameters grid. |
| F4 | Open any active visual assist. If the visual assist is not active, you can press ENTER and then F4 to open the visual assist. When selecting from the list of valid values, you may type in the value you need in the filter box, and then press Alt+S to select the value. |
Calculation flow view
The purpose of the flow chart view is to show you how your calculations inter-relate. This view is useful for visualizing complicated calculation logic. The flow lines show which calculations flow into which (flow direction indicated by the arrow). Also, the Value column shows the evaluated values (if available) for each stage of the flow. In the example below we see that the Account category calculation feeds in the YTD calculation (for this row, the value it passed the value GLG9)
You can see calculations in flow chart view as follows:
1) If you double-click a calculation column header in your DAS report.
2) If you are in the calculation editor in list view and you click the magnifying glass next to the calculation editor

| To | Do this |
|---|---|
| Go back to the calculation list view | Click the Back to list view button at the top of the flow chart |
| Expand and collapse levels of detail | Click the top Level of detail arrow to collapse to higher levels of the flow chart. Click the bottom Level of detail arrow to expand to more detailed levels of the chart |