Parent Child Hierarchy
Description
Allows you to create a tree-level grouping of records when a parent-child relationship exists, leveraging two fields.
Calculation Editor
Options
| Input Parameter Values | Input Values | Required |
|---|---|---|
| Parent Column | Column | ✔ |
| Child Column | Column | ✔ |
| Parent Label | Column | ✔ |
| Child Label | Column | ✔ |
| Max tree depth | Literal integer (Default is 10) | |
| Show Parent Detail | Check box | |
| Auto format | Check box | |
| Start point | Literal integer | |
| Running Factor | Column or Literal integer |
Remarks
- Max tree depth: Defaulting to 10, max tree depth determines the maximum number of grouped levels that will appear in the Parent Child Hierarchy grouping.
- Show Parent Detail: Default checked. When checked, the calculation will show the parent detail for each level. Sometimes you will want to show this detail line and other times not. To suppress the parent row, uncheck this option.
- Auto format: By leaving Auto format checked, the hierarchical structure for the parent and child relationships is created. If the Auto format is unchecked at the initial creation of the Parent Child Hierarchy calculation, there will be no grouping created and the outputted column information will include Parent Column and Parent Label (or Child Column and Child Label) concatenated into one record output.
Warning
The Auto Format option does override any existing groupings in the report.
- Start Point: Enter any value, list of values, range, or valid filter to define which items to show at the top of the tree. If blank, the tree top will be all the items that have no parent.
- Running Factor: When parent items scale quantities of child items, then set the Running Factor to the quantity column.
Understand JDE Tree Structures
JD Edwards has many tree-formatted data tables: Organization Charts, Bill of Materials, Menu Structure, Company structure. The common pattern between each of these tables is that the table information has these two columns: a parent column and a child column. In this pattern, the parent column can have multiple children. Each child in turn can be a parent of even more children. Furthermore, in some cases such as the Bill Of Materials table, a child can belong to more than one parent. In general this pattern looks like:
A1
|
|---B1
| |
| |---C1
| |---C2
|
|---B2
etc.
The Parent Child calculation in Data Access Studio transforms the linear data in the table to a dynamic tree structure like above. Once in the tree form, you will immediately see the structure of the information in your tables. Furthermore, you can create reports that roll up information per this structure. For example, you can do head count by supervisor.
Example
To use the Parent Child calculation:
Open a table with a parent column and a child column (e.g. the employee master F060116 (address number and supervisor)).
Optional, but recommended: get the Associated description for the child column and parent column.
Click Design > Calculations
Select Parent Child Hierarchy
In the Parameters tab, select the parent grid column in the Parent column
Select the child grid column in the Child column
Select the Associated Descriptions you created in step two for the Parent label and Child label
Click Save and Close
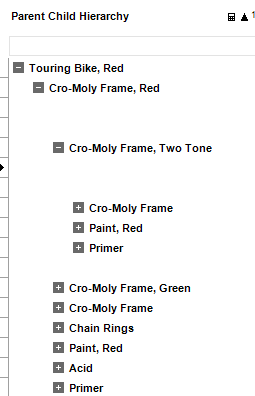
When you click Run Report, you will see the structure of the information in the table as seen below.