Show Month Trends
If your data contains date information, you may want to see how your data changes by month. To see month trends in your data:
Right-click a column in your grid that you would like to trend.
Select Trending | Month Trend.
Sample screen shot
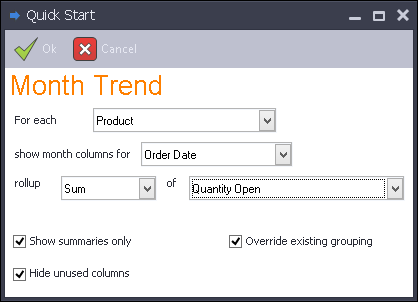
Select the column you want to rollup for the month trend. Data Access Studio will automatically populate this field with the column you select in step 1.
Select the date column you want to use.
Choose how you want to trend: Sum, Count, etc.
Choose the column you want to use as the ranking quantity. E.g. Sales Quantity. If you selected Count in the previous step, then this field will be hidden.
Click
 Ok.
Ok.