Uniform Buckets
Description
Method of diving a range of values into a specific number of equally sized buckets. Each bucket contains a range of values that is the same size as the other buckets.
Calculation Editor
Options
| Input Parameter Values | Input Values |
|---|---|
| Bucket Size | Literal Whole Number |
| Lower Limit (Optional) | Literal Number |
| Upper Limit (Optional) | Literal Number |
| Only Rollup If | Generic Criteria |
Input
| Input | Input Values | Required |
|---|---|---|
| Input 1 | Column or Literal | ✔ |
Remarks
Make sure to change the Bucket Size from 0 as this will output only blank values.
Examples
Example 1
- Input:
- Bucket Size: 10
- Lower Limit: 0
- Upper Limit: 100
- Input: Gross Amount with values ranging from 1 to 100
- Output: [0,10], [11,20],... [>=100]
Example 2
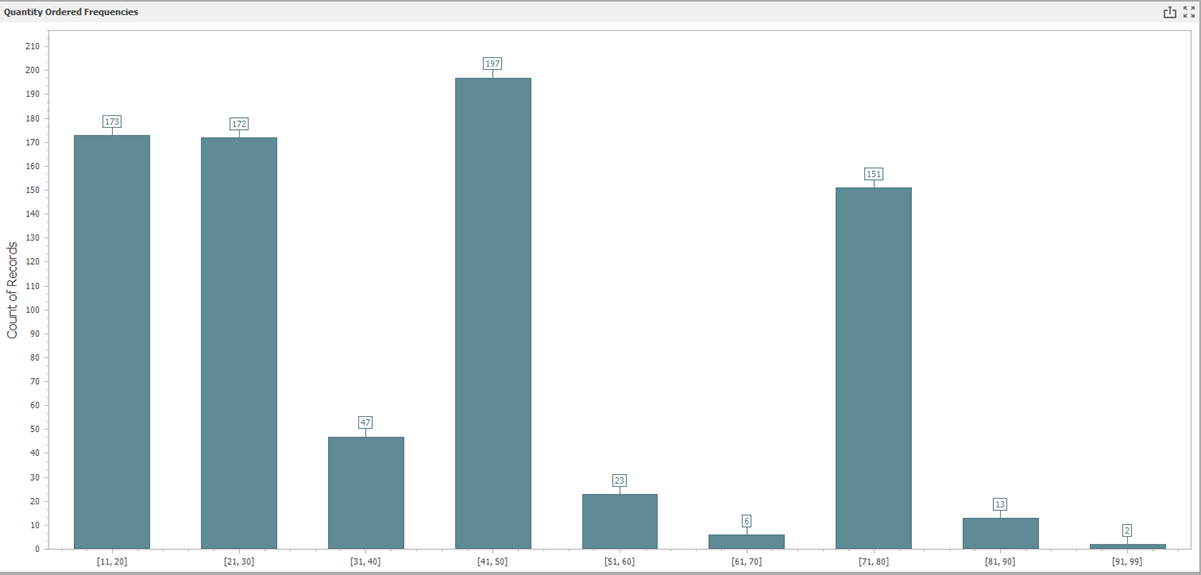
Let's say you want to create a histogram to evaluate the frequency that different quantities of product are ordered in your business. You can utilize the Uniform Buckets calculation to create a calculated column that can be used for your bar chart. This example will utilize a Sales Order Detail Table (F4211 and the quantity ordered field)
- Start by going to Design > Calculations and creating a Uniform Buckets Calculation.
- Set your bucket size to 100 (or whatever is appropriate for your quantity range). Feel free to set an upper and lower limit as needed.
- Create a dashboard off of this report.
- Create a Bar chart where your argument is the uniform bucket and your value is quantity ordered.
- Format your dashboard as you see fit, but note that you can now analyze the frequency that different bins are selected based on quantity ordered.