Excel Pivot Tables and Charts
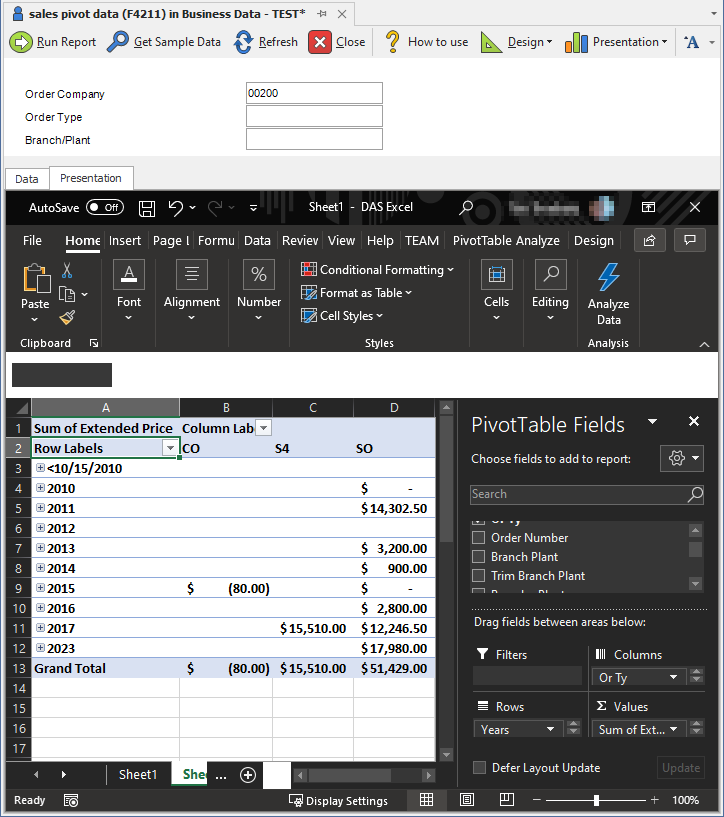
Both manual and automatic presentations support embedding pivot tables and charts. This allows advanced Excel users to leverage a powerful feature of Excel with DAS. The data in DAS is mapped to Excel without grouping or expanded groups, and then a pivot table or chart is linked to the mapped data.
Important Limitations
Note
Columns that use variables in caption names (such as conditionals ('<within>') or relative periods calculations) should have those variables removed before being used by a pivot table or chart. Excel pivot tables and charts cannot reliably handle changing column caption names and will silently remove these columns from the pivot when the caption name changes.
Note
Excel slicers are not supported.
Pivots in Manual Presentations
If you do not have to display the source data brought in by DAS, it is recommended that you use a manual presentation to back your pivot table or chart. A manual presentation performs better since it only brings in data and does minimal styling processing in Excel. This feature is ideal when the report only shows a pivot table or chart.
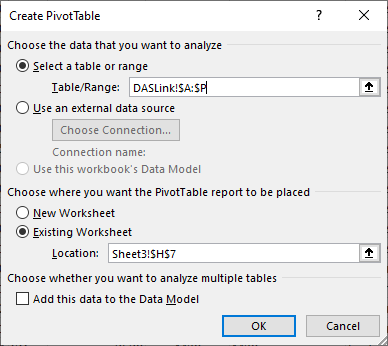
When creating the pivot table or chart, make sure to select just the columns in the DASLink page to ensure that the pivot datasource works with varied row counts coming in from DAS.
Pivots in Automatic Presentations
If you need to display the data in addition to your pivot table, the automatic presentation is recommended.
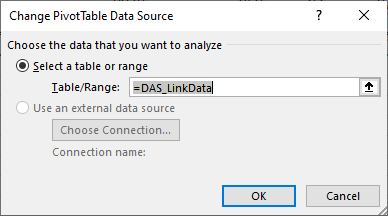
When creating the pivot table or chart, use the 'DAS_LinkData' named range to ensure that the pivot datasource works with varied row counts coming in from DAS.
Pivots in Automatic Presentation With No Data
When pivot tables are included in Automatic presentation layers, they result in messages popping up on the Presentation tab whenever there is not yet data run for the report.
If the report has not retrieved data yet (Run Report, Get Sample Data), the below message will appear when viewing the presentation tab. Fetch data to see the presentation layer fully mapped.
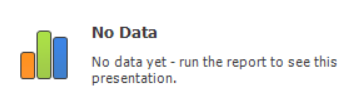
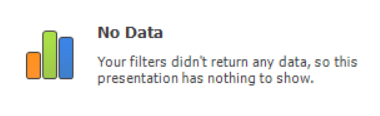
If the report has been run, but there are no data rows returned based on filtering, the below message will appear. The presentation tab can be seen again as soon as data is returned in the report.