Providing Data
This topic describes how to bind the Pie Map dashboard item to data using the Dashboard Designer.
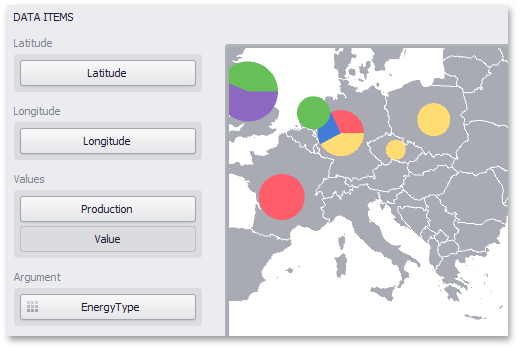
The image below shows a sample Pie Map dashboard item that is bound to data.
Note that the Pie Map provides two data item groups for data binding: DATA ITEMS and TOOLTIP DATA ITEMS. Tables below list the available data sections.
DATA ITEMS
| Section | Description |
|---|---|
| Latitude | Accepts a dimension used to provide geographic latitude. |
| Longitude | Accepts a dimension used to provide geographic longitude. |
| Values | Accepts measures used to calculate pie values. In case of negative measure values, Pie Map uses their absolute values. If you added a data item to the Argument section and several data items to the Values section, you can use the Values drop-down menu to switch between the provided values. To invoke the Values menu, click the  icon in the map's caption or use the map's context menu. icon in the map's caption or use the map's context menu. |
| Argument | Allows you to provide data for pie arguments. |
TOOLTIP DATA ITEMS
| Section | Description |
|---|---|
| Dimensions | Accepts dimensions allowing you to add supplementary content to the tooltips. |
| Measures | Accepts measures allowing you to add summaries to the tooltips. |