Providing Data
The only difference is in the data sections that the required dashboard item has. This topic describes how to bind a Pie dashboard item to data in the Designer.
Binding to Data in the Designer
The image below shows a sample Pie dashboard item that is bound to data.
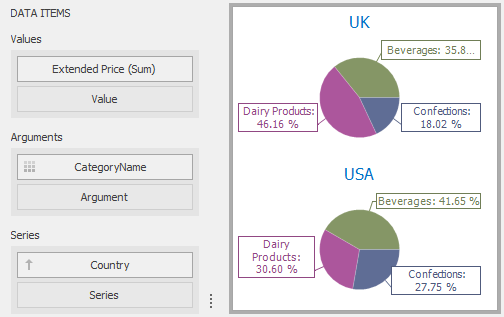
To bind the Pie dashboard item to data, drag and drop a data source field to a placeholder contained in one of the available data sections. A table below lists and describes Pie's data sections.
| Section | Description |
|---|---|
| Values | Contains data items that define the share of pie segments. In case of negative measure values, Pie uses their absolute values. |
| Arguments | Contains data items that provide values used to label pie segments. |
| Series | Contains data items whose values are used to label pie charts. |
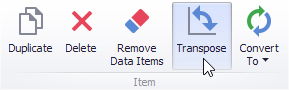
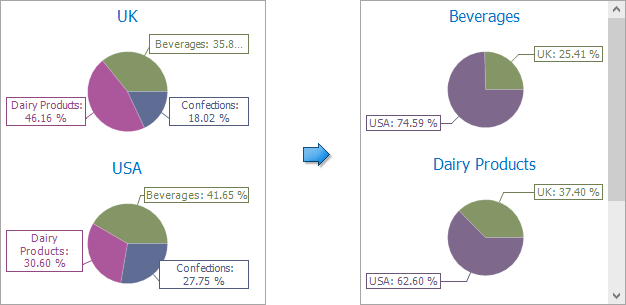
Transposing Arguments and Series
The Pie dashboard item provides the capability to transpose pie arguments and series. In this case, data items contained in the Arguments section are moved to the Series section, and vice versa.
To transpose the selected Pie dashboard item, use the Transpose button in the Home ribbon tab.