Interactivity
This document describes the features that enable interaction between the Range Filter and other dashboard items. These features include Master Filtering.
Master Filtering
The Dashboard allows you to use any data-aware dashboard item as a filter for other dashboard items (Master Filter). To learn more, see the Master Filtering topic, which describes filtering concepts common to all dashboard items.
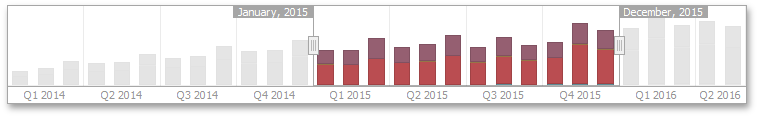
Master filtering is always enabled for the Range Filter dashboard item. This Range Filter displays a chart with selection thumbs that allow you to filter out values displayed along the argument axis.
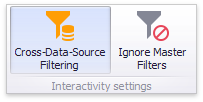
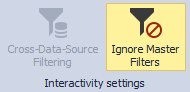
To enable filtering across data sources for the Range Filter, use the Cross-Data-Source Filtering button in the Data Ribbon tab.
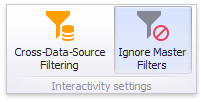
You can enable/disable ignoring of other master filter items using the Ignore Master Filters button in the Data Ribbon tab.
Selection Parameters
Creating selection parameters allows for different controls on your dashboard to selectively references the extents of your range supporting filter controls without using master filtering. Selection parameters for your data allows you to set and compare different fiscal periods and predefined ranges. This allows comparisons between companies, between identical time periods year-over-year, etc. As an example, You could designate a chart to reflect data in two different ways:
- Chart one period AND another period
- Chart one period OR another period
To create selection parameters, add a Range control or a Date Filter control. After configuring this control, click the 'Generate Selection Parameters' button from the design ribbon of the control.
Click the Generate Selection Parameters button.
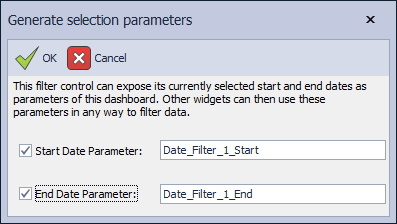
Generate the start and end dates for each of the parameters you are defining. When generating parameters, you may use the default names provided or create your own.
Create another control that will be filtered by these new selection parameters. For example, you can create a chart or pie chart.
Note
Make sure the control has a dimension that matches the type of the selection parameters. For example, if the range filter is by day-month-year or exact date, the control must have a day-month-year visible or hidden dimension. Alternatively, if the range filter is just year, the control must have a an numeric representing a year as a visible or hidden dimension.
With the focus on the chart, disable master filtering. This is important because you want the chart to manage filtering manually by using the generated selection parameters of the range or date filter control.
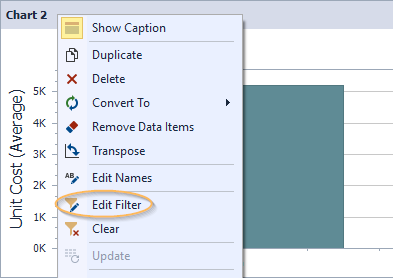
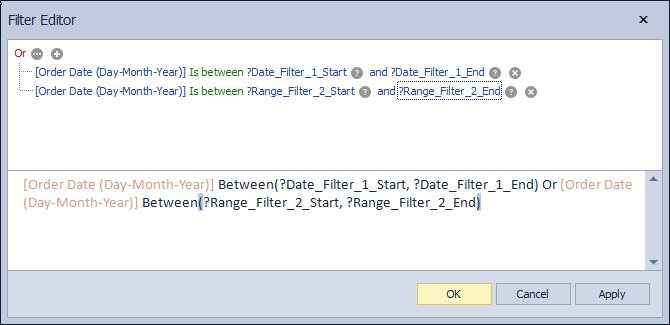
With continued focus on the chart, right-click and select Edit Filter.
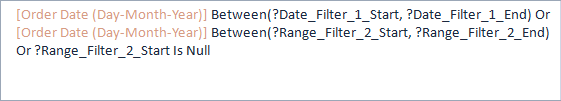
Set the filter according to the parameters that you want to view.
Note
When using the Range Control, the start and end parameters will not be immediately set until the user moves the thumb controls. If you want the chart to show all data initially, you will want to check for this parameter with the IsNull function. You will need to manually type this expression in the editor.