Summary Level Aggregations
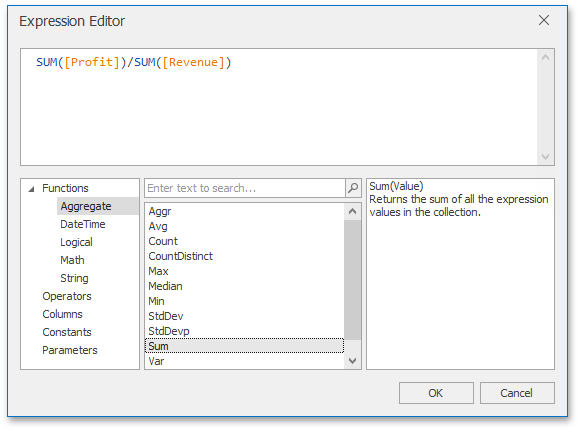
The Dashboard Designer aggregates data when you construct a calculated field expression. This allows you to evaluate calculated fields on a summary level.
In the Dashboard Designer, you can use the following set of predefined aggregate functions:
| Function | Description |
|---|---|
| Aggr(SummaryExpression, Dimensions) | Aggregates underlying data using the detail level specified by a predefined set of dimensions and a specified summary function. For more information, see Intermediate Level Aggregations. |
| Avg(Value) | Returns the average of all the values in the expression. |
| Count() | Returns the number of values. |
| CountDistinct(Value) | Returns the number of distinct values. |
| Max(Value) | Returns the maximum value across all records. |
| Min(Value) | Returns the minimum value across all records. |
| Median(Value) | Returns the median of the values. |
| Sum(Value) | Returns the sum of all values. |
| Var(Value) | Returns an estimate of the variance of a population where the sample is a subset of the entire population. |
| Varp(Value) | Returns the variance of a population where the population is the entire data to be summarized. |
| StdDev(Value) | Returns an estimate of the standard deviation of a population where the sample is a subset of the entire population. |
| StdDevp(Value) | Returns the standard deviation of a population where the population is the entire data to be summarized. |
These functions can be used for all types of numeric fields.