Data Presentation Basics
The Dashboard supports three types of Geo Point maps.
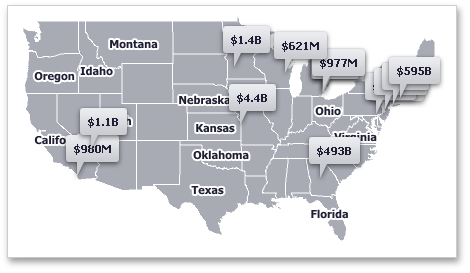
The Geo Point Map dashboard item allows you to place callouts on the map using geographical coordinates.
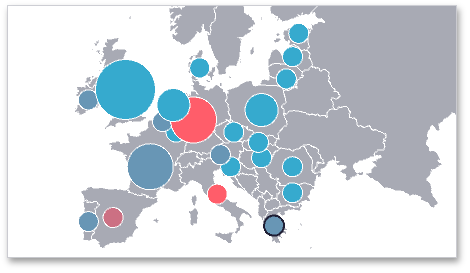
The Bubble Map dashboard item allows you to place bubbles on the map. Each bubble can represent data via its weight and color.
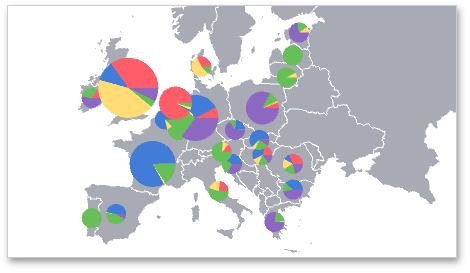
The Pie Map dashboard item allows you to display pies on the map. Each pie visualizes the contribution of each value to the total.
Map Zooming and Scrolling
You can use the mouse wheel to change the current zoom level for a map. To scroll the map, hold down the left mouse button and drag it.
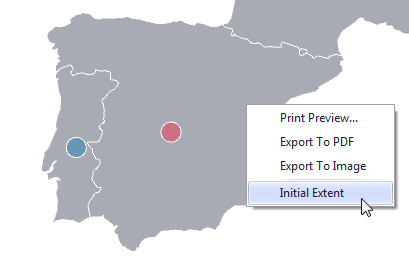
To move to the initial zooming and scrolling state, click the Initial Extent menu item in the map's context menu.
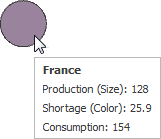
Tooltip
A Geo Point Map dashboard item can display a tooltip that shows information on a hovered callout/bubble/pie.