Summarize Data in a Chart
Overview
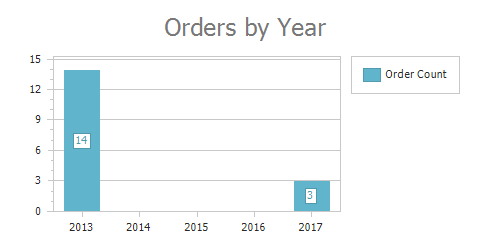
When charting data using numerical or date/time arguments, the chart may be simplified by consolidating data points into a smaller set. For example, daily transaction data can be shown by month or year.
There are two related techniques for summarizing data on a chart. Generally, the scale options of the X-Axis will be used first and then the series summary options when such things like Count Distinct are needed.
- Scale Options of the X-Axis
- Summary Options of the series.
Scale Options of the X-Axis
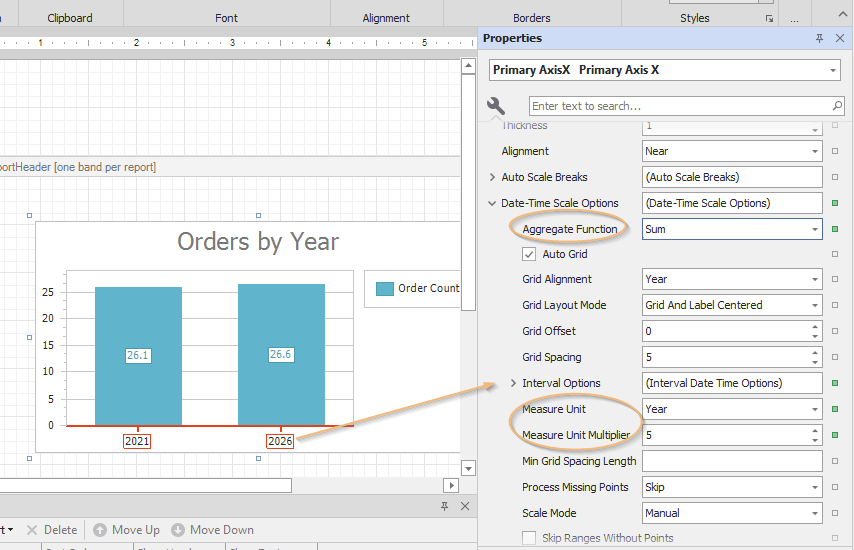 Properties as seen from the main property window
There are many scale options for the X-Axis. These are the key properties for summarization.
- Aggregate Function: Method for aggregating the set of values for each summarized argument. If setting this function, the Summary Options of the Series Aggregate Function should typically be set to None.
- Minimum, Maximum, Sum, Count, Histogram, Financial
- Custom is not used.
- Measure Unit: The summary unit for the argument. For date/time, this will be from milliseconds to years. Unused if the Summary Options of the Series 'Use Axis Measure Unit' option is not set.
- Measure Unit Multiplier: Allows for aggregating multiples of the selected measure unit (aggregate for every 10 years, 6 months, etc.). Unused if the Summary Options of the Series 'Use Axis Measure Unit' option is not set.
Summary Options of the Series
After creating a chart with a date/time or numerical argument with any type of value, select the series in the chart designer and navigate to the 'Date-Time Summary Options' or 'Numerical Summary Options' properties under the Data section of the Properties tab.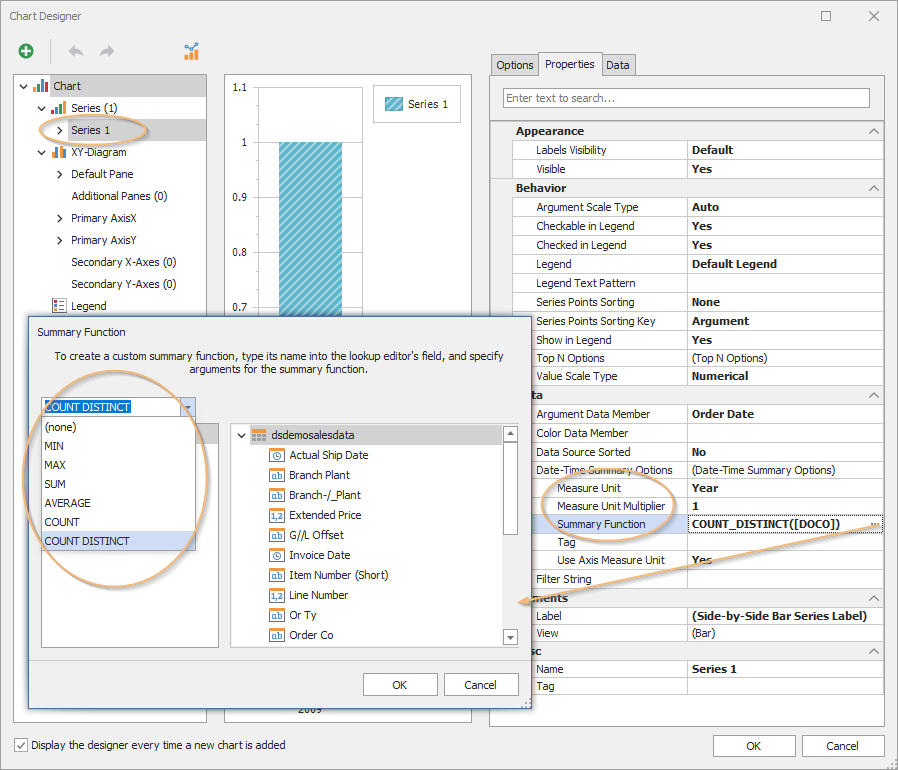 Properties as seen from the Chart Designer
From here, you have a few key properties:
- Measure Unit: The summary unit for the argument. For date/time, this will be from milliseconds to years.
- Measure Unit Multiplier: Allows for aggregating multiples of the selected measure unit (aggregate for every 10 years, 6 months, etc.)
- Summary Function: Method for aggregating the set of values for each summarized argument. If setting this function, the X-Axis scale option's Aggregate Function should typically be set to None.
- MIN, MAX, SUM, AVERAGE, COUNT, COUNT DISTINCT
- Tag: Unused.
- Use Axis Measure Unit: If selected, Measure Unit and multiplier in this section are ignored and the properties of the same name in the X-Axis scale options will be used instead. Set by default.