Automatic Presentation Styles
The automatic presentation feature provides a rapid way to style your presentation. Consider the following four screen shots:
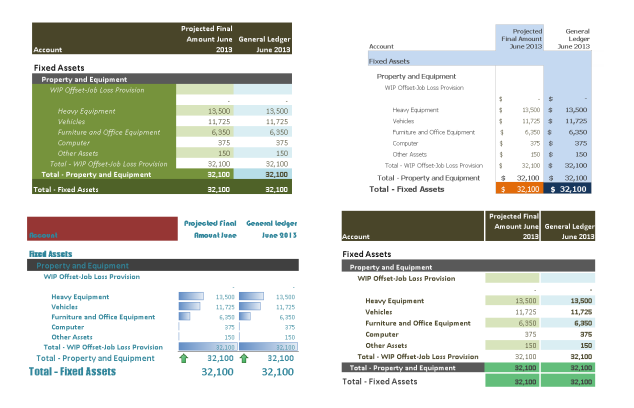
Each is a different style for the same report. With one click, the user can transition between each of the above styles.
A style is any Excel format (color, font, size, numeric precision, conditional format, border, etc.) that you specify for a specific element. You can see that it is possible, for instance, to do odd-even row shading and conditional formatting.
Pre-built DAS Styles
To get you started with styles, DAS ships with about 30 pre-defined styles. To try out a predefined style on a report with an Automatic presentation, click Presentation > Styles.
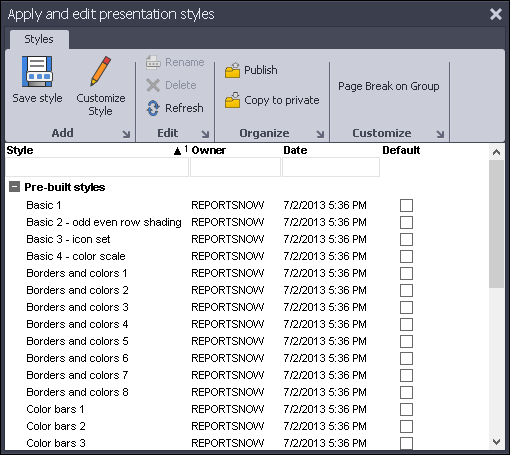
Click any row and your automatic presentation will apply the style you selected. See Managing Styles for more information.
How Do DAS Styles Work?
Now that you've had a chance to play with the pre-built DAS styles, let's consider how styles work. Once you understand this, you can create and save your own custom styles.
First, why do we need DAS styles? Without DAS styles, you would be forced to format your Excel presentation cell by cell. The problem with this approach, other than tedium, is that as soon as your data changes, all of your formatting is incorrect. So this approach clearly cannot work for reports in general.
As opposed to styling cell by cell, DAS Styles format by a cell's type. A cell has two components to its type: the Row Type and the Column Type.
Row Types
| Row Type | Description |
|---|---|
| CAPTION | The text in the header part of the grid column |
| GROUP | The text for the group by each group level |
| DETAIL | The text and amounts at the detail lines |
| TOTAL | The text and amounts for a group's total at each level |
| GRANDTOTAL | The data for the column grand total |
| DEFAULT | The default formatting |
| SPACER | The spacing between a total and the next group |
So given this simple set of types you can, for instance, define that you want the Group caption to be Arial, font size 14, and blue. No matter what the input data (whether it's 100 rows or 100,000 rows), the group styling will always be correct. Note that row types are referenced by the literal labels in the table above. Also, GROUP, TOTAL, and SPACER support appending a number to specify "at which level". For example, GROUP1 means the styling for group level 1.
Column Types
| Column Type | Description |
|---|---|
| GROUP | The group column |
| FIRST | The first column |
| LAST | The last column |
| DEFAULT | Any column by default |
| USER_DEFINED | Any user-defined style to be applied by column (note that the Type in this case can be any name - it does not have to be USER_DEFINED). You may also specify as many user-defined column types as you need. |
The column types let you specify column-specific styling in conjunction with the row type.
The DAS_STYLES sheet
When you combine Row Types and Column Types you get the DAS_STYLES sheet. All automatic presentations have a DAS_STYLES sheet. This sheet is the matrix of the row types and columns types that define the style for your presentation. When you select a style, this is the sheet that gets updated with the style's data.
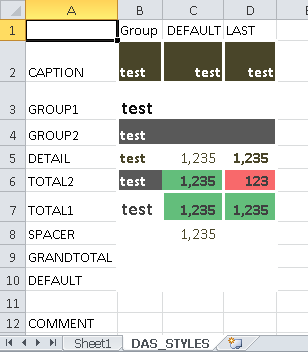
The image above shows the DAS_STYLES for the template "Color Tiles 3". You can see it is simply a spreadsheet of formats for each row and column type. The COMMENT tag means ignore any text below the COMMENT tag.
If you modify any of the formats in the DAS_STYLES sheet, then you customized the style. For instance, in the screenshot above, you could change the GROUP1 text to be blue (Cell B3). Once changed, all your Group level 1 text will be blue. See Managing Styles for more information about saving and publishing custom styles.