Presentations
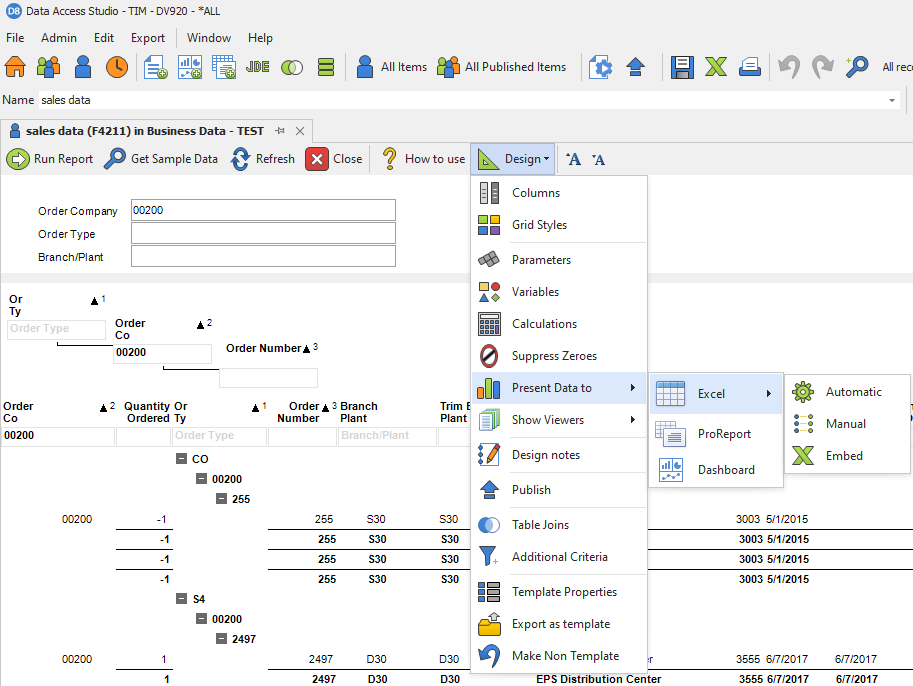
After gathering and transforming data into a logical report, this data will often need to be presented in some way. From presenting in Excel, to being hosted using a BI dashboard, Data Access Studio provides many different methods of presentation. These methods can be access from the Design menu of a report:

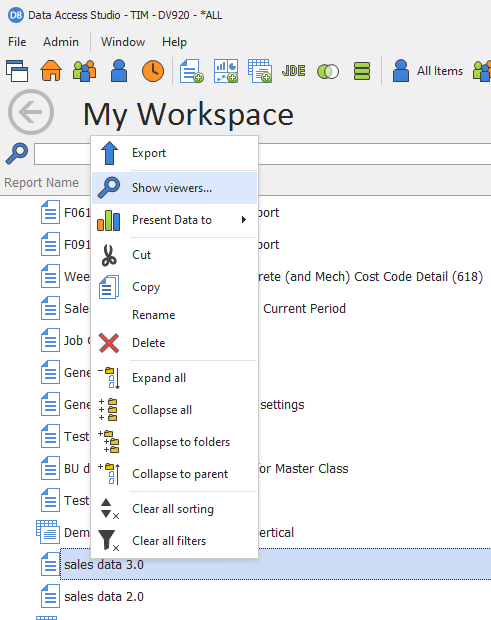
You can also present to a ProReport or a dashboard from your 'My Workspace' or 'Public Workspace' areas.
Summary of presentation methods:
- ProReport will bring up our ProReport New Report Wizard to guide you through constructing an enterprise-grade report.
- Dashboard will bring up our dashboard designer for this report so you can create an interactive BI dashboard.
- Excel Presentation will embed Excel into this report allowing for tight integration with this very useful tool.
Presenting from a Report
Toolbar Menu
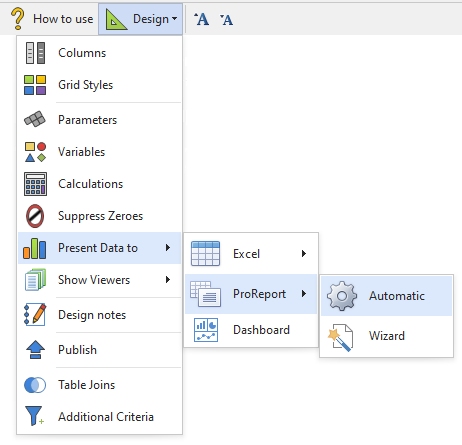
The Report toolbar contains a menu option for presenting to Excel, ProReport and Dashboard.
Present to ProReport from Toolbar
From the menu select Design > Present Data to > ProReport and select the option for Automatic or Wizard.

Grid Popup Menu
The Report grid column headers display a context menu when right-clicked. Options are available to present to Excel, ProReport and Dashboard.
Present to ProReport from Grid
From the popup menu select Present Data to > ProReport and select the option for Automatic or Wizard.

Note
The selected grid column can be unmapped by un-checking the Automatically map this column option, meaning it will not show up in the columns for the ProReport.
Showing Viewers
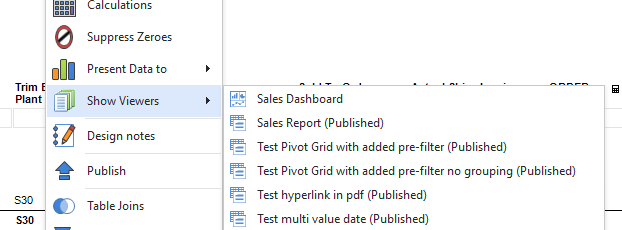
A ProReport or a dashboard that is presenting your data is called a viewer. To manage your development, you will want to be able to see what ProReports and dashboards use your reports. You can see this list from the 'Show Viewers' sub-menu of the design menu of a report. The notation '(Published)' indicates that this viewer is published to mobie.

You can also view this same list from the 'My Workspace' area.
