Add Charts and Excel formatting to your report
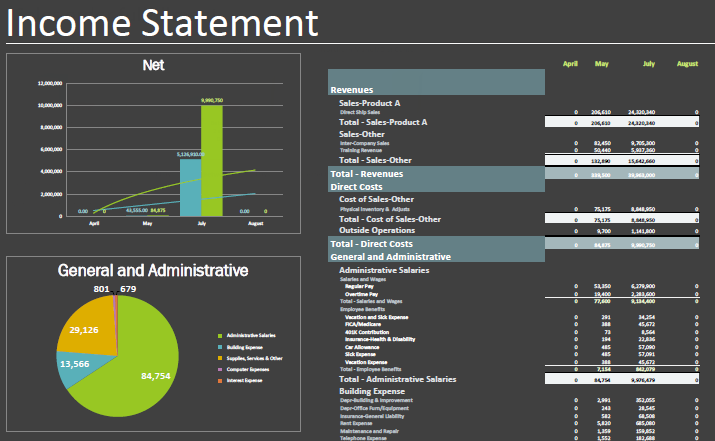
You can present your report with all the features of Excel. With Excel Presentation, your query comes alive with graphs, dashboards, and pixel-perfect formatting:
 |
|---|
Data Access Studio provides two ways to format your report in this manner:
In general, use the Automatic presentation for new reports. The Manual presentation method (which uses row padding for nested groups), is there for legacy reports.