Data Processing Modes
DAS Dashboard supports two data processing modes when running against mobie that are used to perform data-related operations (such as grouping, filtering, etc.). These modes only apply when running against mobie in the dashboard designer/viewer in DAS and does not apply when running directly against DAS reports.
- In server mode, data-related operations are performed on the database server side. For instance, when you apply filtering to a dashboard item, the Dashboard Designer requests the required data automatically by sending a query containing a corresponding SELECT statement with the specified WHERE clause.
- In client mode, data-related operations are performed on the workstation or Web server side. The mobie dashboard loads a compressed snapshot of aggregated data into Web server memory. The dashboard avoids server mode limitations and might improve interactive performance. Data compression, proper data grouping and multi-threading algorithms reduce memory consumption and improve the data shaping operation performance.
Note
It was not possible to publish a dashboard in client mode to mobie until 8.0.11. Server mode will continue to be the default mode for dashboards on mobie.
Tip
Note that performance in server/client modes depends on multiple factors such as database structure, server workload, etc. To decide which mode to use, test both.
Server Mode Limitations
In server mode, the Dashboard does not have simultaneous access to bound data in its entirety. This imposes some limitations.
- Some calculated fields cannot be evaluated in server mode.
- The Median summary function is supported for the Oracle data provider only.
- The Bound Image and Grid dashboard items cannot display images from the following types of databases:
- Microsoft SQL Server
- MySQL
Data Processing Errors
The Dashboard Designer provides the capability to display errors that occurred during data processing operations (such as changing measure summary types, calculation errors, etc.). For instance, the Grid below shows an error when the summary type of the Extended Price measure is set to Median in server mode.
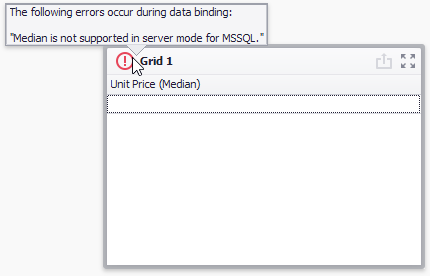
To see the error message, hover the mouse pointer over the  icon.
icon.