Create Shapefile Visuals to Better Understand Business
Innovative Shapefile Creator
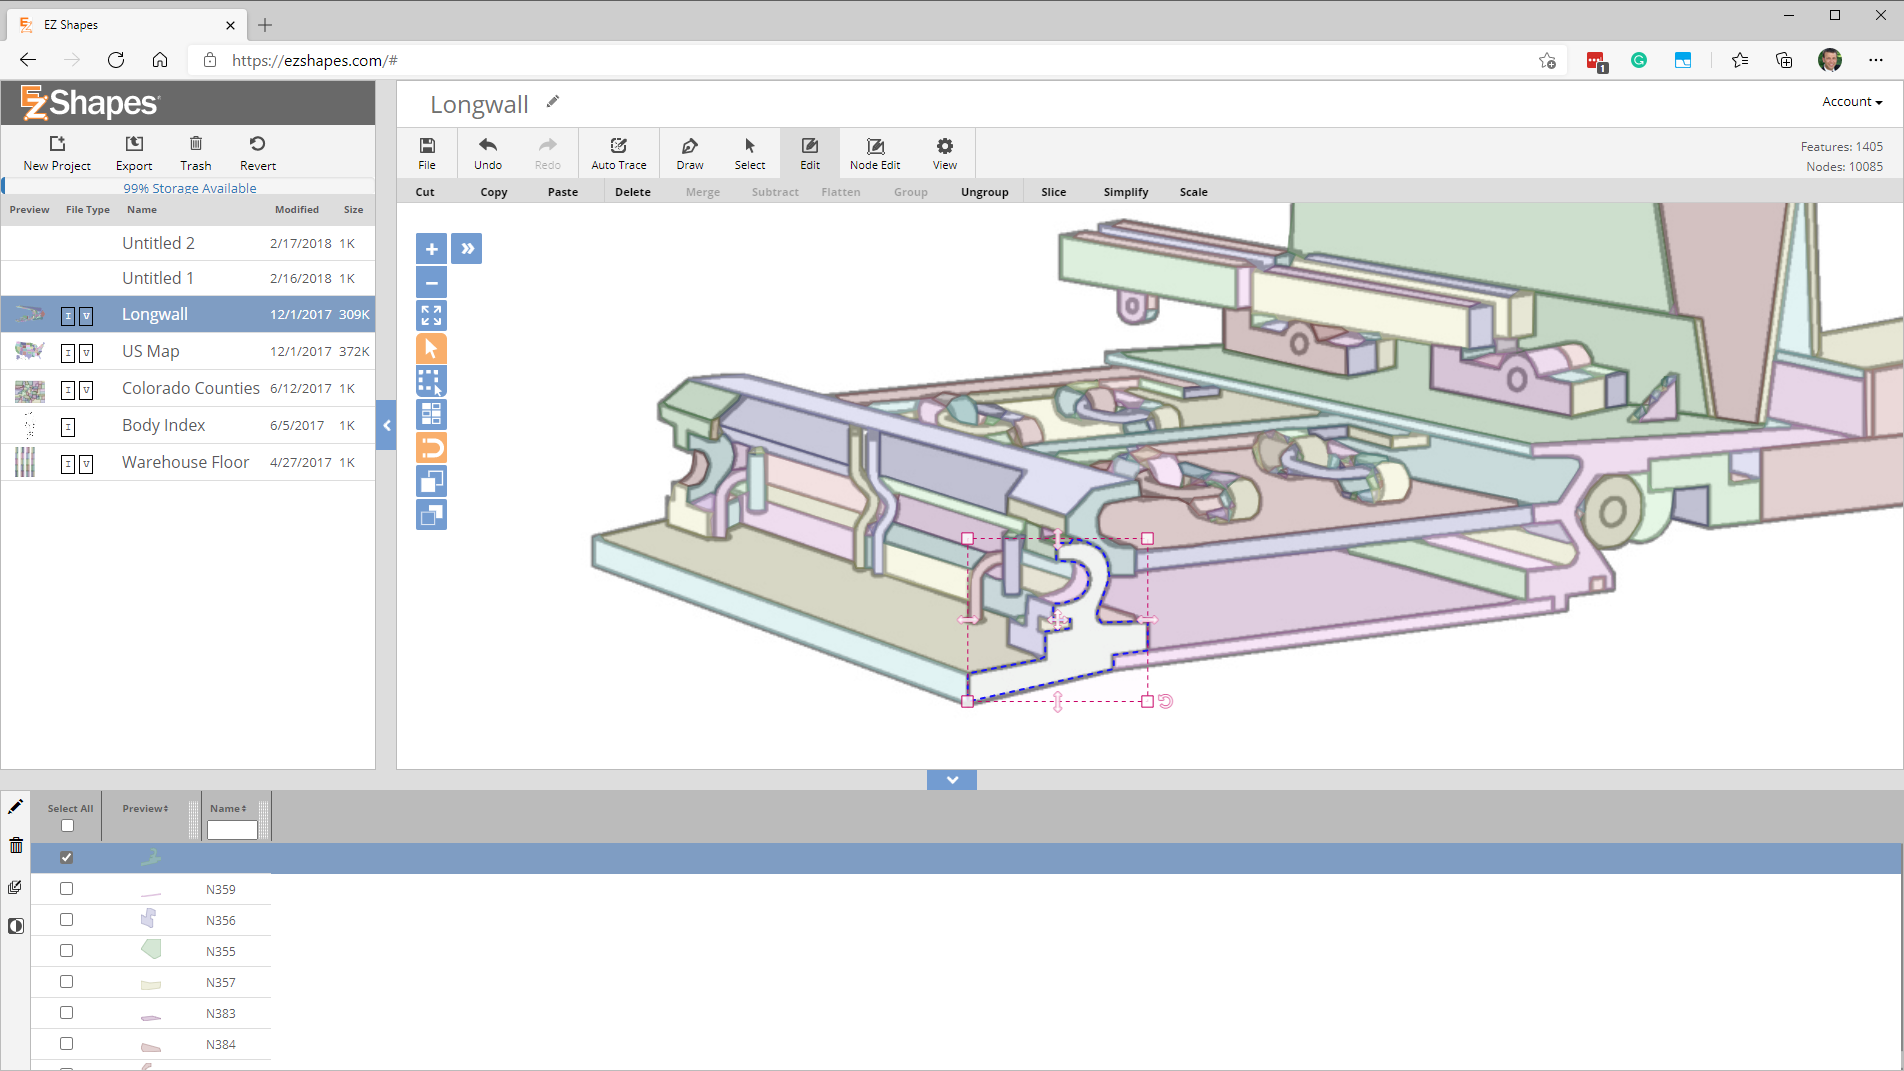
EZShapes® is the only JD Edwards-specific tool that empowers users to create functional shapefiles to pair with their data. Solve the inherent
complications of crafting visuals to display information in non-traditional formats. From the big picture to the smallest details, EZShapes allows JD Edwards data to take shape and offer real-world context.
Reshaping business intelligence
EZShapes captures the detail in images and simplifies them for quicker loading. The browser shapefile creator makes it easy to import and convert complex data shapefiles. A simple web interface can produce custom shapes that bring data to life.
- Create shapefiles from raster drawings such as JPGs, PNGs, GIFs, and BMPs
- Translate results into shapefiles, GeoJSON, and SVG file formats
- Alter graphics using slice, subtract, merge, simplify, and node edit tools
- Modify industry-standard shapefiles
- Reconstruct new or existing diagrams into functional shapefiles
- Operate in a web-based environment without any installations
- Name shapefiles segments to correspond to underlying report fields
Design functional shapefiles
EZShapes converts complex illustrations to shapefiles in one click using snappy raster-to-polygon scanning algorithms. Pairing JD Edwards data with meaningful visuals results in a fresh perspective that uncovers trends, patterns, and opportunities.
- Trace existing images automatically
- Manually edit and augment shapefiles for drawings
- Spatially describe vector features with points, lines, and polygons
- Build non-traditional geospatial diagrams
- Simplify existing shapefiles to reduce the level of detail for quick downloads
- Use the converted visuals inside mobie® dashboards
- Correct and touch up images with a built-in scanning algorithm
