Built to Make JD Edwards
More Powerful
Data Access Studio 8
Data Access Studio™ (DAS) is an all-in-one JD Edwards-centric reporting and business intelligence (BI) solution. DAS brings an added level of
sophistication to any report for stunning enterprise-level outputs. With augmented scalability and performance, DAS is a premier tool by which all other JD Edwards solutions are measured.

A real-time reporting platform for JD Edwards
Data Access Studio enables users of all levels to create JD Edwards queries, real-time reports, and interactive dashboards. DAS touches almost every facet of JD Edwards to empower users. It replaces cumbersome reporting processes with an intuitive, user-friendly alternative. Easy to implement and roll out across the entire enterprise, DAS immediately turns raw JD Edwards data into actionable analytics.
- Connect to JD Edwards data using best-in-class integration
- Inherit out-of-the-box JD Edwards row and column security, formatting, localizations, and visual assists
- Create complex logic by combining multiple functions into a single calculation, without the need for coding
- Format data using an intuitive presentation layer
Unparalleled data access
Generate new insights from enterprise data by linking your JD Edwards reports to external information sources. With ReportsNow, combine data from multiple areas of the business to discover new trends and meet evolving objectives.
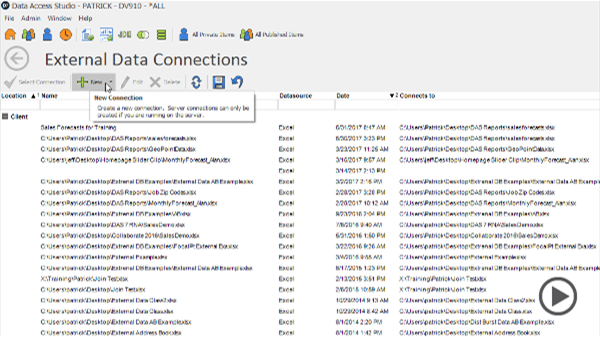
- Query and report against both JD Edwards and non-JD Edwards data (Excel, SQL, Access, Oracle, DB2, cloud apps)
- Slice and dice data from multiple sources on a single report or dashboard
- Automate report distribution
- Design reports in a single pixel-perfect layout
- Consume reports in real time and access dashboards from any device
- Embed visuals into EnterpriseOne pages and applications
Simpler search capabilities
Successful report writing starts with finding where the information resides within JD Edwards. DAS zeros in on precise JD Edwards elements using an intuitive search tool. Even novice DAS and JD Edwards users can both build from scratch and easily modify existing reports.
- Access all JD Edwards data across any business view, module, and table including custom tables
- Locate JD Edwards data using natural language instead JD Edwards-specific terminology
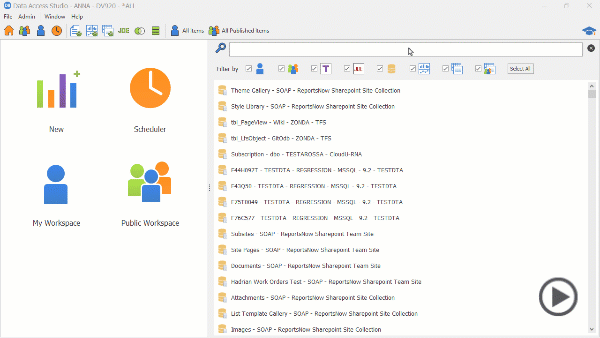
- Search through a catalog of hundreds of pre-written ReportsNow templates
Unmatched JD Edwards reporting
ReportsNow unlocks the power of JD Edwards data with the capabilities that simplify report and dashboard creation. DAS paves the way for citizen developers by empowering non-technical users to design and create reports without burdening IT departments. DAS is a solution that places strategic intelligence at end-user’s fingertips by making JD Edwards both more powerful and effective.
- Implement the only reporting and BI solution that sits natively atop JD Edwards with a one-hour install
- Create reports in minutes without assistance from IT
- Eliminate the typical JD Edwards deployment processes such as promotions and package builds
- Use both out-of-the-box and customizable report drill-downs
- Add dynamic hyperlinks inside of reports
- Mix and match 80+ calculations in a virtually unlimited number of ways
- Install with any version of World and EnterpriseOne
Powerful ProReports functionality
ProReports™ is a DAS8 presentation feature that gives users ultimate control and interactivity. ProReports can meet your most sophisticated business formatting needs. It combines the composition capabilities of a word processor with computational data analysis to provide powerful conditional formatting and editable expressions.
- Operate a user-friendly ProReports wizard for drag-and-drop report formatting
- Merge rich text and visualizations on an intuitive design surface for stunning reports
- Use a property grid for greater pixel-by-pixel control
- Include visual components such as charts, gauges, images, signatures, watermarks, and barcodes
- Combine multiple DAS reports into a single layout with summarized grouping levels
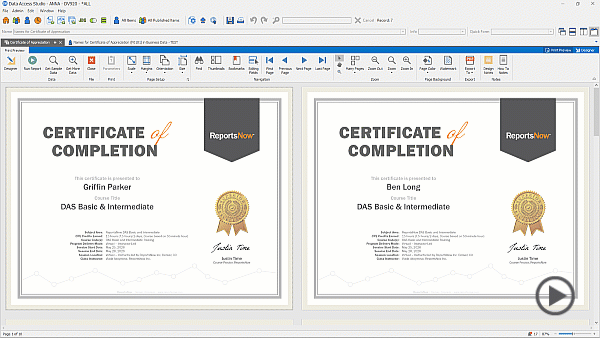
- Create catalogs, vendor reports, financial statements, AP reports, W-4s, invoices, and other forms
- Access sub-reports
- Place data over pre-printed forms
