See the Story
Hidden in Your Data

Mobile Business Intelligence for the Enterprise
Mobie® is mobile business intelligence for every type of enterprise application. It provides the strategic intelligence that every company needs. Harness the power of a fully automated BI stack that produces graphical narratives with built-in JD Edwards smarts.
Explore mobie® on your own
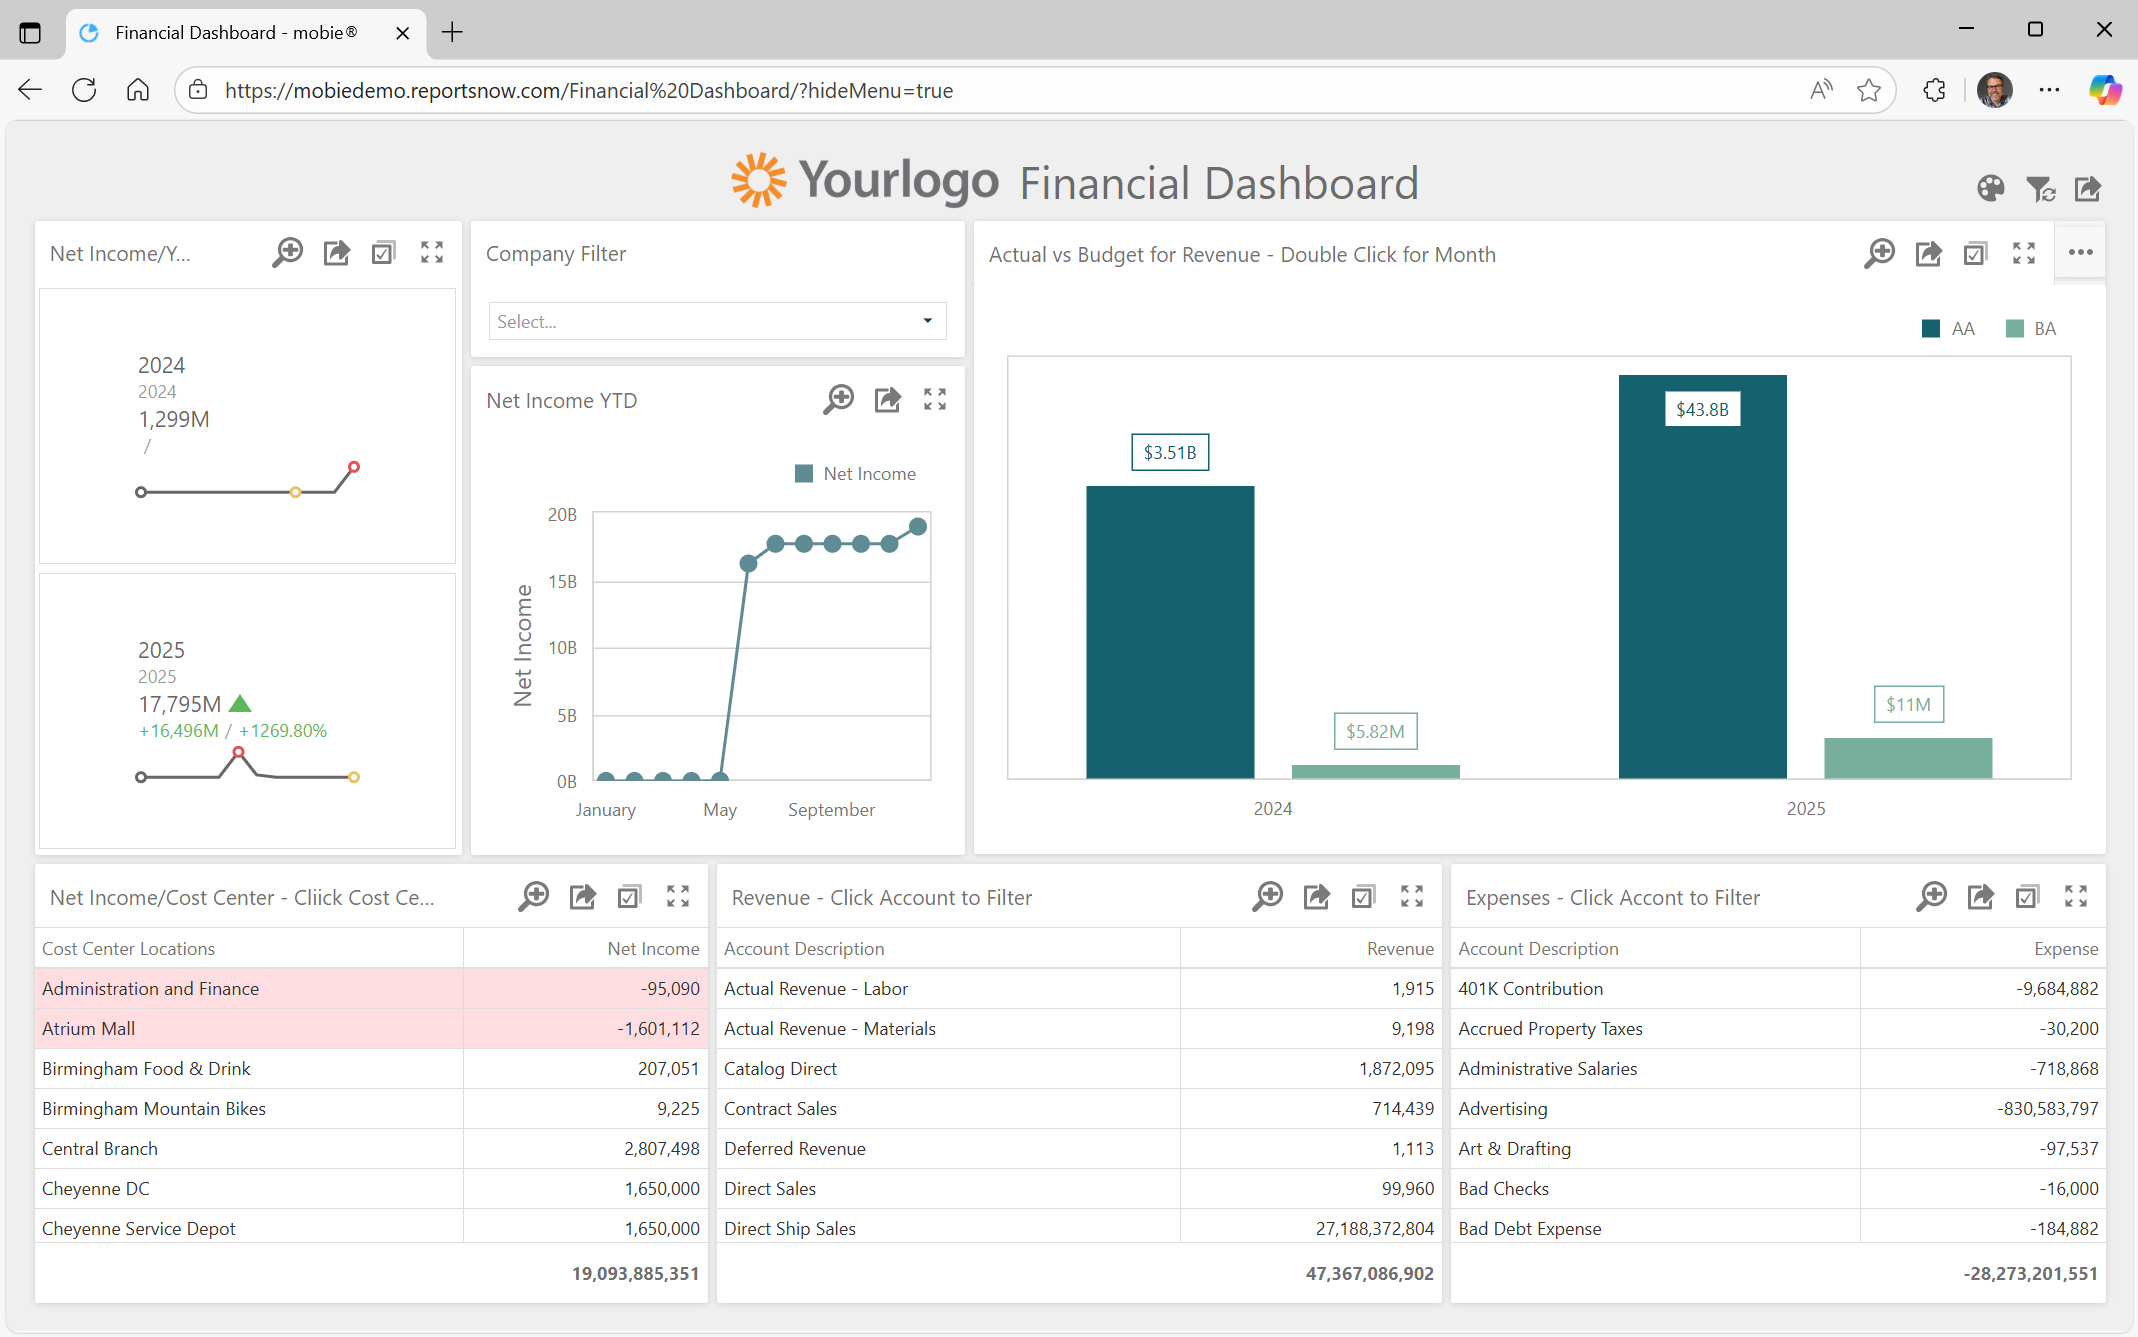
Enables accountants and executives to access key financials such as YOY, YTD net income, and budget vs. actuals. View visual breakdowns of income, revenue and expenses by cost center.
Ready to try it with your own data?
See the story hidden in JD Edwards data
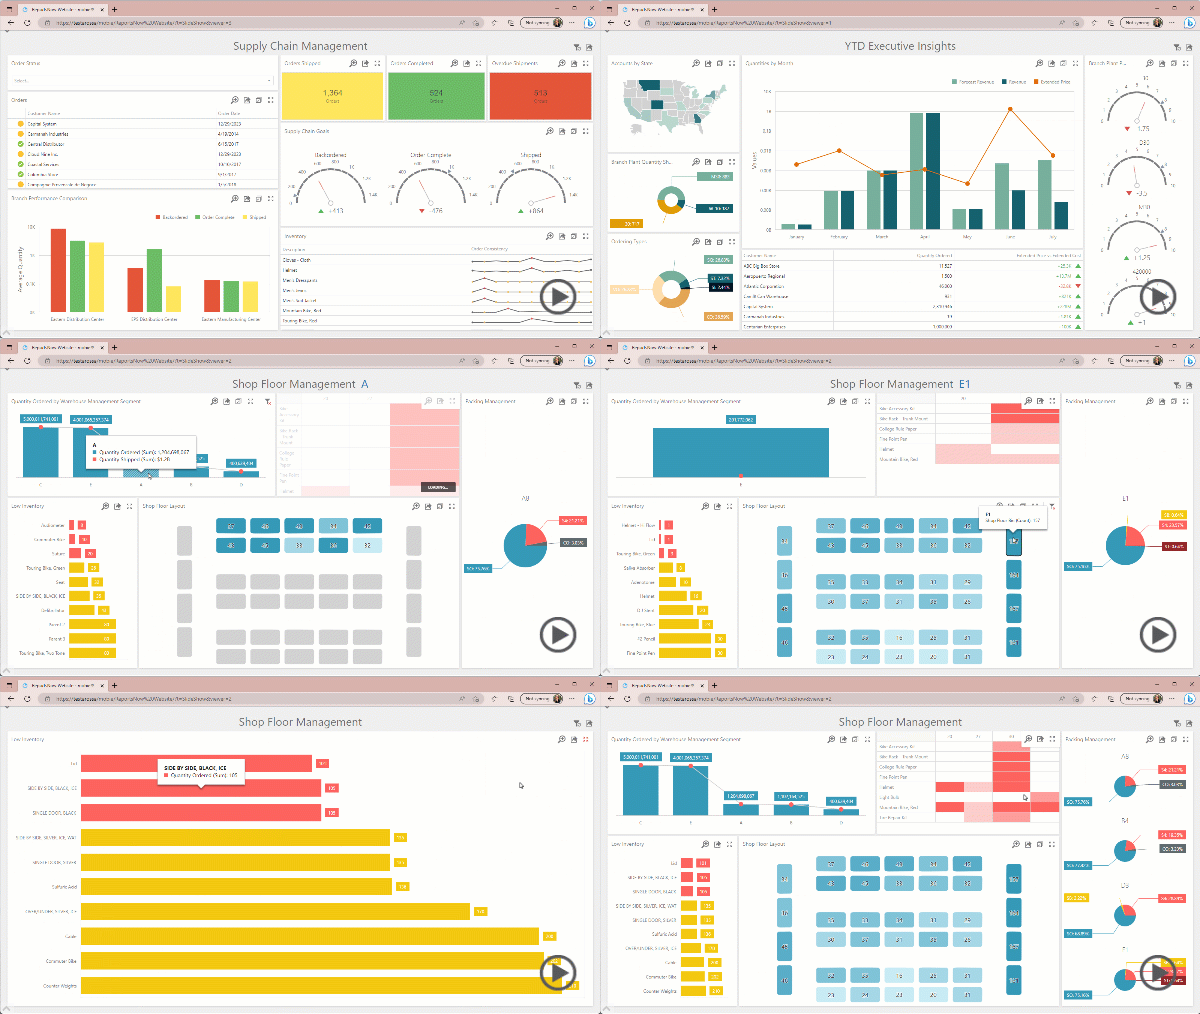
Mobie transforms raw data into interactive visualizations that identify business trends to uncover a hidden story. Consolidate multiple reports into a single interface that combines disparate applications and centralizes vital insights. Watch mobie illustrate a comprehensive business picture in ways that no solitary report can.
- Extract, transform and assemble data from multiple reports into a Web-based interface
- Use any type of DAS report to build dashboards
- Construct slide shows by mixing and matching dashboards and ProReports
- Create optimized data warehouses to accelerate dashboard and ProReport loading time
- Publish dashboards and ProReports to JD Edwards users, non-JD Edwards employees, external parties, and portals
Total dashboard interactivity
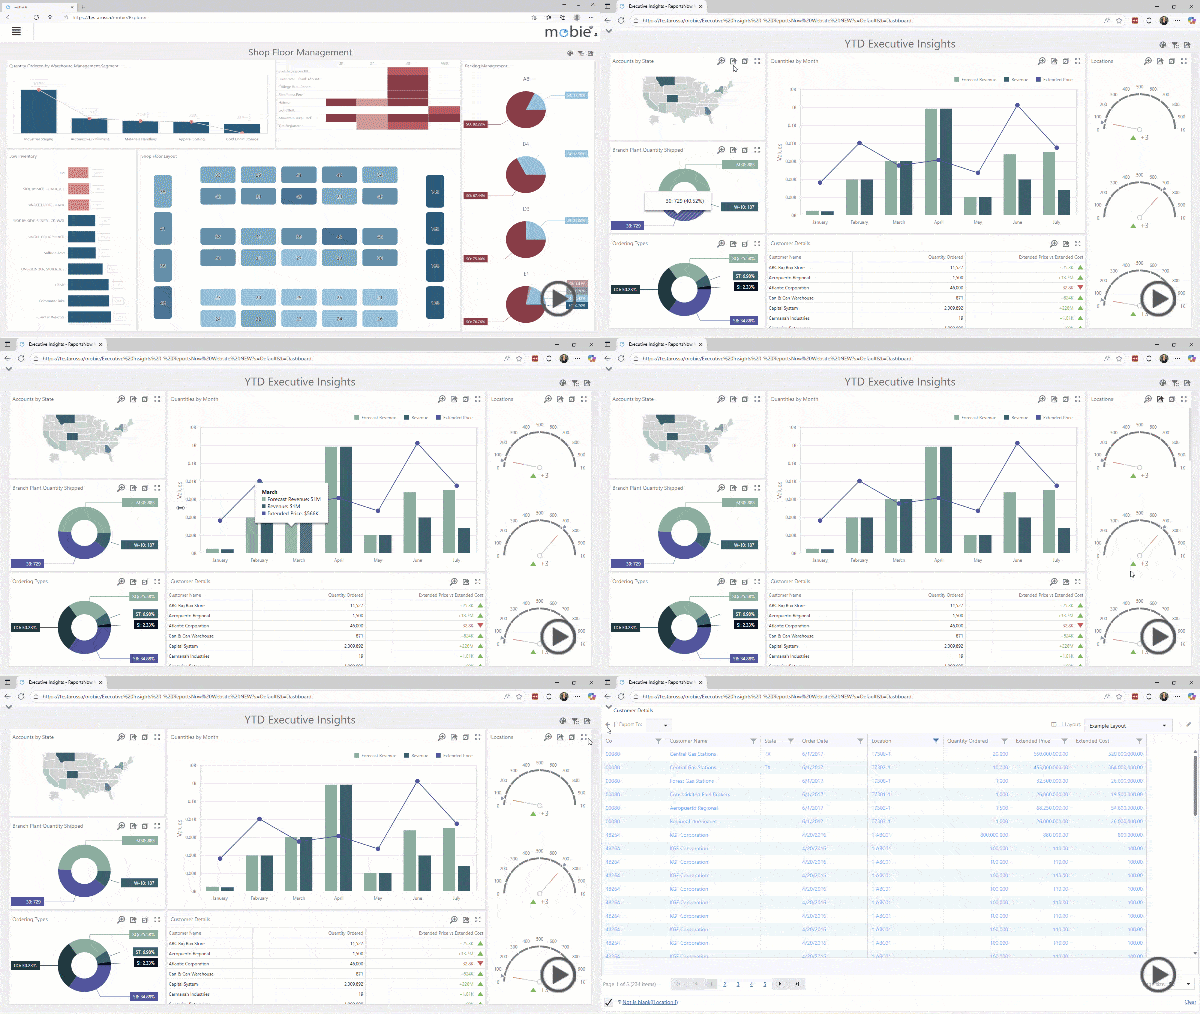
Mobie provides complete interactivity of visualizations. Master filtering, interactive widgets, and the intuitive drag-and-drop design allow users to construct dashboards in a virtually unlimited number of ways. Users can tailor their experiences to their business needs.
- Centralize a variety of data widgets into a single dashboard
- Publish and access dashboards from any type of browser or device
- Interact with a touch-enabled display that uses intuitive charts and graphics
- Design schemes with a drag-and-drop feature
- Create hyperlinks between dashboards
- Drill down inside widgets to view underlying data details
Endless possibilities
Mobie builds sophisticated, inquiry-based reporting systems that can be made available on the Web. With the combined power of other ReportsNow products, mobie yields results that simplify strategic intelligence processes.
- View sophisticated dashboards and ProReports on any Web-based device
- Manage the frequency and recurrence of data-refreshing with Automator
- Make key performance indictors timely, relevant, and accessible
- Watch your data take shape using custom EZShapes® shapefiles and choropleth maps


